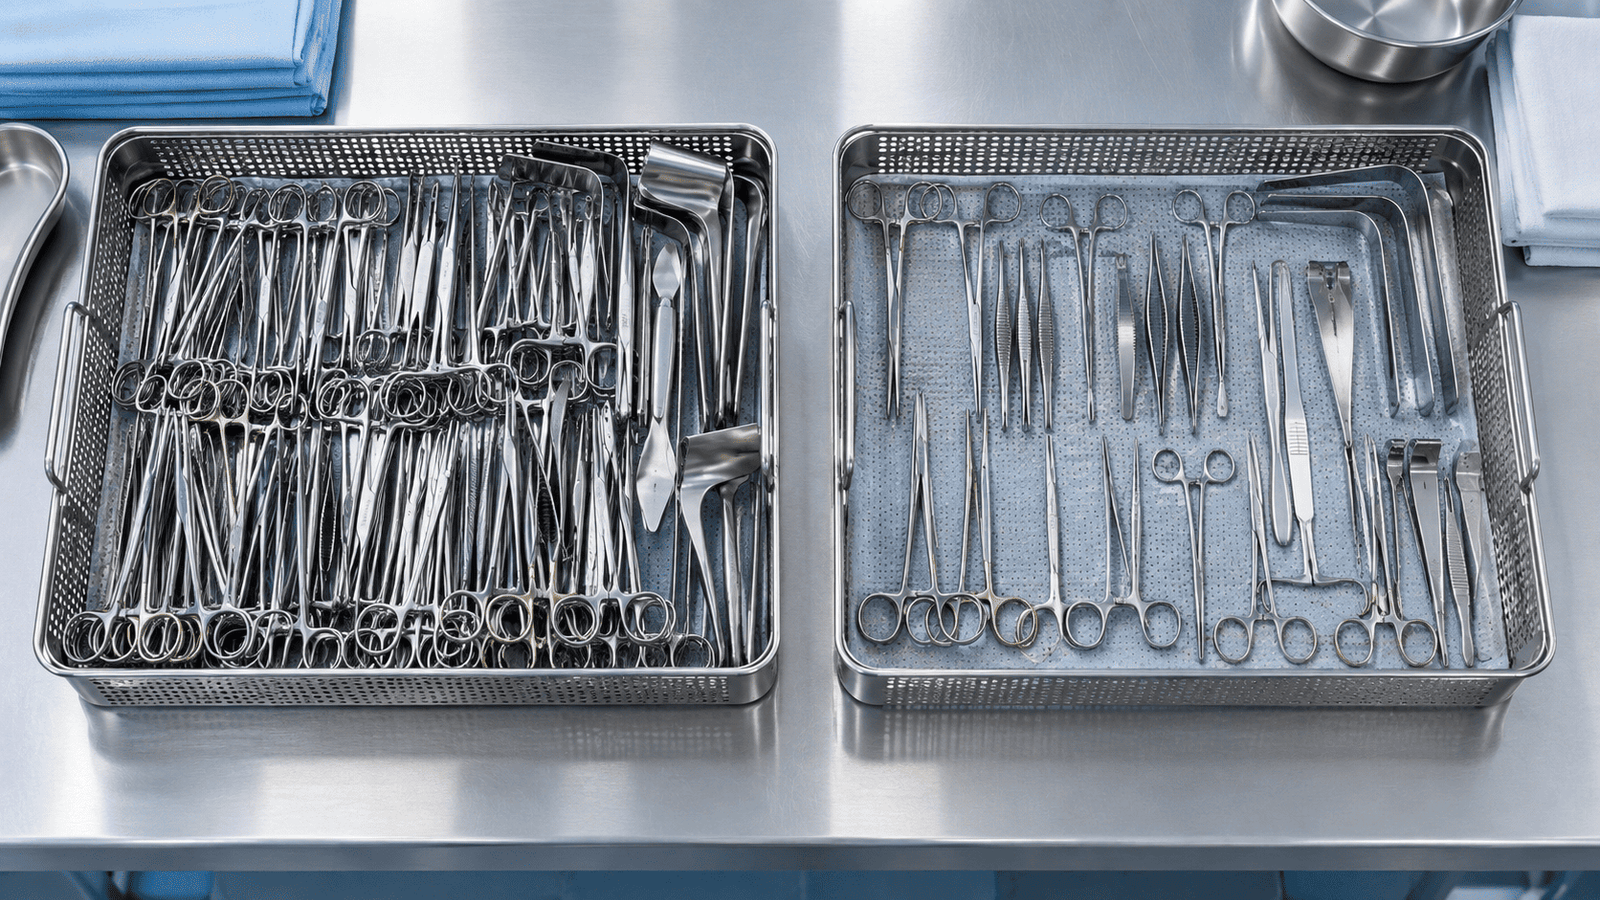
A major general surgery tray is opened. Ninety-four instruments are counted in, laid out, counted back. Nineteen get used. The other seventy-five are washed, inspected, reassembled, wrapped, sterilised and counted again, for nothing. That is not a badly run hospital. That is the published average.
Surgical instrument tray optimization is the practice of removing instruments that are rarely or never used from a set, and rebuilding the set around what the procedure actually needs. It is one of the few decisions in an operating theatre that cuts cost, cuts reprocessing labour, cuts setup time, cuts tray weight and cuts sterilisation failures at the same time, without touching clinical technique.This guide gives you the measured utilisation rates by specialty, the true cost of an unused instrument, the four methods used to decide what comes out, the safety limits you must respect, and how to turn the decision into a rebuilt set you can actually order. Every figure is sourced and dated.
The short answer
- How much of a tray gets used? Between 10.7% and 58% of instruments, depending on specialty and tray. Ambulatory hand surgery measured 10.7%. Orthopaedic trays measured 23.4% before optimisation.
- What does an unused instrument cost? Roughly $0.51 to $3.19 each time it is reprocessed, before you count assembly time, setup time and wear.
- How much can you safely remove? Published reductions cluster at 30–55% of tray contents. Twenty studies in one review reported cuts above 50%.
- What is the fastest method? Direct observation of real cases. It consistently finds more to remove than asking staff from memory.
- Where is the hard limit? A packaged set should not exceed 25 lb (11.3 kg) including the basket, instruments and wrap, per ANSI/AAMI ST79 and ST77.
- What is the usual cut-off? Flag any instrument used in fewer than 20% of cases for review. Do not remove on that number alone.
Why trays grow and never shrink
Every instrument on a tray got there for a reason. A surgeon asked for it in 2009. A new technique needed it. A registrar wanted a spare. A supplier bundled it into the original set.The problem is that trays have an inbound process and no outbound one. Adding an instrument takes one conversation. Removing one takes an audit, a committee, a count-sheet revision and a container change, so nobody does it. The Aarhus University Hospital review of this process put it plainly: attention has gone almost entirely into adding instruments to keep up with new methods, and almost none into removing the ones that newer methods made redundant. Electrocautery is the clearest case. It displaced a great deal of traditional haemostatic work, but the
artery forceps and ligature clamps that did that work are still counted onto trays in the same quantities.Three forces keep the tray fat:
- Preference layering. A tray shared by six surgeons ends up carrying the union of six preference lists, not the intersection.
- Insurance thinking. One instrument needed once a year feels cheaper to keep than to fetch. It is not, and this guide quantifies why.
- Naming drift. The same instrument enters a count sheet twice under two names, so the tray carries two of it. This is common enough that we wrote a separate reference on it: surgical instrument tray lists and the names that collide.
How much of a tray actually gets used
The measured number has a name in the literature: the utilisation fraction. It is instruments used during a case, divided by instruments opened for it. Here is what audits have found.
| Specialty / tray | Opened | Used | Utilisation | Source |
|---|
| Ambulatory hand surgery (19 cases) | 120.1 ± 10.9 | 12.6 ± 5.4 | 10.7% ± 4.8% | Hand, 2024 |
| Aortic trays | — | — | 12.5% | Vascular analysis, via Vizient |
| Major general surgery (162 procedures) | 94 | 19 avg; 10 never used at all | ~20% | Netherlands prospective, 2025 |
| Neurosurgery trays | — | — | 21.9% | Four-service survey, via Vizient |
| Vascular trays | — | — | 22.9% | Vascular analysis, via Vizient |
| Orthopaedic trays, before optimisation | 792 across 11 tray types | — | 23.4% | Lean orthopaedic study |
| Paediatric urology trays | — | — | 21.1% – 49.1% | Urology PDSA study |
| Spine and gynaecology | — | — | 20.5% – 58% | Aarhus overview |
| Neurology + orthopaedics (38 audited cases) | — | — | 58% used at least once | Standardisation study, via Vizient |
| Four services combined (ENT, plastics, bariatric, neuro) | — | — | ~13% (87% unused) | Four-service survey, via Vizient |
Two points matter more than the individual numbers.First,
the spread is enormous and it is specialty-specific. A 58% figure and a 10.7% figure came from the same kind of audit done properly. You cannot import someone else’s answer. You have to measure your own trays, which is why the method section below matters more than the benchmark table.Second,
“used at least once” and “used in most cases” are different questions, and confusing them is the commonest error in this work. The 58% figure counted an instrument as used if it was touched once across 38 cases. That instrument is still a candidate for removal if it was touched once in 38.
Measure the tray, not the theatre. The Aarhus team found that counting total instruments across the whole inventory gives a more accurate picture than instruments-per-tray, because a tray reduced from 88 to 47 pieces still multiplies across every copy of that tray you own. One centre had 102 physical copies of 11 tray types.
What one unused instrument really costs
Most cost arguments in theatre stop at the purchase price. That is the smallest part of an instrument’s lifetime cost, and for an unused instrument it is the irrelevant part, because the money is spent every single time the tray is opened, used or not.
| Cost layer | Measured figure | Notes |
|---|
| Reprocessing, per instrument per cycle | $0.51 – $3.19 | The Stockert and Langerman basis used across the tray-reduction literature |
| One institution’s own costing | $1.56 per instrument | Central sterile processing estimate, US academic centre |
| Packaging effect | $0.34 – $0.47 in a tray vs $0.81 – $0.84 peel-packed | From our own cost analysis. Pulling an instrument out of a tray into a peel pouch roughly doubles its per-cycle cost. See reusable vs disposable surgical instruments |
| Assembly labour | Assembly time fell 58% – 66% after optimisation | Four ENT procedures, measured over three months |
| Theatre setup time | Setup time fell 26% – 37% | Same study; a minimally invasive spine study reported 37% |
| Theatre minute cost | $36 – $38 per minute | From our own analysis; applies to setup and count time |
| Instrument loss | ~1% loss rate, up to $350,000 estimated cost to a hospital | More instruments in circulation, more to lose |
| Wear from pointless cycles | Not directly costed | Repeated washing and sterilisation wears instruments that were never used clinically, and eventually forces replacement |
| Share of perioperative cost that is materials and supplies | Up to 56% | This is the budget line tray optimisation attacks |
Now the arithmetic that convinces a finance committee. Take one instrument, on one tray, used 2,000 times a year and never needed. Removing it saved one health system
$920 annually. Removing the full set of such instruments across their programme returned about
$55,000 a year.Scaled examples from the literature:
- Ambulatory hand surgery. One tray, rebuilt from 120 instruments to 23.2. Annual reprocessing cost fell to $3,260, a saving of $13,603, or 80.7%.
- Paediatric urology. A minor GU tray cut 39%. Saving of $11.22 per procedure, about $3,489 a year on that tray alone; three further trays took the potential to $14,588.
- Spine surgery. Three different reduction methods on two trays produced annual savings of $44,418 to $50,211.
- Minimally invasive spine and deep brain stimulation. A 70% instrument reduction produced roughly $60,000 a year.
- Whole-programme. One centre reported savings up to $500,000 a year once reprocessing, packing, counting time and replacement of lost or damaged instruments were all counted.
- Per-procedure range across all studies. A 2025 systematic review in BJS Open found reported cost reductions from €0.19 to €387.78 per procedure. The width of that range is the honest answer to “what will we save”: it depends entirely on how bloated the tray was.
If you are building the business case for a clinic rather than a hospital system, our companion piece on
reducing surgical instrument costs without compromising quality sets out the purchasing side of the same problem.
How much has been removed in practice
This is the table to take into the meeting where someone says a reduction is theoretically nice but practically impossible.
| Study / setting | Reduction achieved | Secondary effect |
|---|
| Scoping review of tray-reduction studies | >50% in 20 studies; 26–50% in 9; <25% in 7 | Confirms the effect is real and specialty-dependent |
| Orthopaedics, Lean method, 11 tray types | 433 of 792 instruments removed (55%), 3,520 instruments across 102 physical trays | Usage rose 23.4% → 54.2%. Weight down 574.3 lb (22%). Review took 7 min 35 s per tray |
| Major orthopaedic tray, mathematical model, 80 procedures | 88 → 47 instruments (47%) | Model beat clinician review on the same tray |
| Major general surgery tray, observation-based | Size and weight down 54%; cost down 55% | Survey-based review of the same tray achieved only 22% |
| Thoracic surgery, three departments | 41% | Reproduced across departments, not a single-site fluke |
| Single-site multi-tray audit (Farrelly) | 34% average per tray | Nine of 21 trays withdrawn from service entirely |
| Commercial optimisation programmes | 30–40% average across major service lines | Benchmark for what a vendor-led project targets |
| Paediatric urology, GU minor tray | 39% | After reduction, only 10% of cases needed an extra instrument opened |

Four methods for deciding what comes out
The methods are not equivalent. They differ in how much they find, how long they take, and how much political cover they give you.
| Method | What it is | Typical yield | Effort | Use when |
|---|
| 1. Clinician review | Surgeons mark up the count sheet from memory and judgement | Lower. One study: 22% instrument reduction vs 54% by observation | Hours | You need buy-in fast, or observation is not feasible. Never use it alone on a very large tray |
| 2. Direct observation | An observer records every instrument used, case by case, over weeks | Highest. 54% reductions reported; also the method that identified the most removals in head-to-head comparison | Weeks of observer time; 80–162 cases in published studies | The tray is high-volume, so the payback justifies the observation cost |
| 3. Mathematical / inventory model | Usage data fed into an optimisation model that returns an ideal configuration | High. 88 → 47 instruments in one orthopaedic tray | Technically demanding, laborious to set up | You already have reliable usage data, and a data analyst |
| 4. Hybrid (structured survey + cost inflection) | Surveyed usage estimates, then a cost-based cut-off analysis | 38% in a spine study, close to observation, at a fraction of the effort | Moderate | Most hospitals, most trays. Best effort-to-yield ratio in the published comparisons |
Two findings from the comparison studies are worth knowing before you choose.
Memory understates. When the same tray was reviewed both ways, observation found roughly two and a half times as much to remove as asking staff. If you only have the survey route, expect to leave money on the table and plan a second pass later.
Surgeons cut harder than scrub staff. In the Netherlands study, surgeons supported more removals than scrub nurses did. That is the opposite of what most project plans assume, and it matters for who you put in the room. Scrub staff carry the consequence of a missing instrument, so their caution is rational and should be answered with a retrieval plan, not overruled.
Already know what your tray should contain?
Send us the count sheet. We manufacture to specification in Sialkot and quote set builds directly, with no distributor layer. Email
info@njmedicalinstruments.com or WhatsApp
+92 333 8733922 with your list, quantities and preferred patterns, and you get a line-by-line quote against your own numbering.
Setting your cut-off threshold
Every study needs a rule for “rarely used”. The most commonly published rule is
used in fewer than 20% of cases. That is a flag for review, not an instruction to remove.
| Threshold | What it means | Effect | Best for |
|---|
| <10% of cases | Conservative. Removes only the near-dead weight | Smaller cut, near-zero clinical pushback | First pass on a high-acuity or emergency tray |
| <20% of cases | The literature default | The reductions in the tables above mostly come from this rule | Elective, high-volume, predictable procedures |
| Cost-inflection point | Remove where marginal reprocessing cost exceeds the expected cost of retrieving the instrument when needed | Defensible in financial terms; needs your own per-instrument cost | Hospitals with real CSSD costing data |
| Unanimous clinician agreement | An instrument leaves only if every clinician agrees | Slowest and smallest cut, but no-one can object afterwards | Politically difficult services; only four of five studies that specified removal criteria used this |
Combine two of them. Use the 20% rule to generate the candidate list, then require clinician sign-off per line. That gives you the yield of a data rule and the durability of a consensus rule.One instrument class deserves a standing exception: anything whose absence stops the operation and whose substitute is not on the tray. A single haemostatic clamp pattern or a specific
needle holder size can be used in 5% of cases and still belong on the tray, because the 5% is the bleeding one. Rarity is not the same as dispensability, and no threshold rule can tell the difference. A clinician has to.
Weight, density and the wet-pack problem
Tray optimisation is usually sold as a cost project. Its most underrated benefit is sterility assurance, because the heaviest, densest trays are the ones that fail.
| Limit | Value | Why it exists |
|---|
| Maximum packaged set weight | 25 lb (11.3 kg), including basket, instruments and container or wrap | ANSI/AAMI ST79 and ST77. Heavier sets are hard to dry, raising wet-pack risk, and pose a lifting-injury risk |
| Typical loaner set weight before this limit was enforced | Up to 35 lb | Loaner and orthopaedic sets are the usual offenders; ST79 asks for a written loaner policy naming the 25 lb ceiling |
| Maximum tray footprint | 30 × 30 × 60 cm (the sterilisation-unit definition) | Chamber loading and steam penetration |
| Ergonomic reference | NIOSH Lifting Index above 1.0 signals elevated injury risk | AORN’s safe-handling guidance was built on it |
| Spacing between sets in the chamber | About 1 inch | Condensate control |
The mechanism is density, not weight alone. Twenty-five pounds of instruments spread over a bench dries easily. The same mass packed into a tray presents far less free surface area, so steam struggles in and condensate struggles out. Hinged instruments, which is most of a general tray, must be packed open for this reason:
scissors and haemostats with closed ratchets trap moisture in the box lock.The orthopaedic Lean study measured the payoff directly. After removing 55% of tray contents, the number of trays coming out with holes in the wrapping fell from 13 to 1. Each of those holes is a set that has to be reprocessed, and a case that may be delayed.One more detail that trips up newly built trays: gauze, raytec and four-by-fours cannot be used as cushioning inside an instrument tray, because they interfere with the surgical count. If instruments need protection, they need a silicone finger mat with its holes aligned to the tray’s drainage holes, a tip protector, or a purpose-made
sterilisation container. For the mesh-versus-solid question, mesh allows steam in and condensate out; solid protects contents in transit and contains them. Choose by which failure you are guarding against.The water side of the same problem is covered in
our sterilisation guidance. Briefly: a denser tray means more crevices, serrations and box locks to rinse and dry, and the final rinse before sterilisation should be with critical-quality water, because the mineral and ionic load left behind by ordinary tap water is what produces the brown staining that gets misdiagnosed as rust.
The risks, and how to control them
Three objections come up every time. All three have measured answers.
“What happens when we need the instrument we removed?”
You open a supplementary pack. In the paediatric urology study, after a 39% cut,
only 10% of cases required an extra instrument to be opened. That is the number to bring to the discussion. Plan for it deliberately: keep the removed instruments available as small, single-instrument or three-instrument peel packs on a nearby shelf, and accept that a peel pack costs roughly double per cycle what the same instrument costs inside a tray. Ten per cent of cases paying double on one instrument is trivially cheaper than 100% of cases paying full price on thirty.
“Won’t a smaller tray cause more errors?”
The evidence points the other way. Reducing the number of instruments on the field has been associated with fewer handing errors, and optimisation narrowed the variability of both assembly and setup times, which is what makes staffing and scheduling predictable. Fewer items also means a shorter count, and counting is where retained-object risk lives.The real error risk is in the transition, not the destination. If the count sheet, the container label and the physical tray disagree for even a week, you have manufactured exactly the confusion you were trying to remove. Change all three on the same day, and record the revision. Our note on
surgical instrument traceability covers how to keep instrument-level records straight through a change like this.
“Our trays are fine, this is a big-hospital problem”
Worth testing before you accept it. A one-year analysis at a 700-bed US hospital processing 23,000 instruments a month recorded 3,900 defects across 42,799 cases:
just over 9% of cases had at least one defective tray. The same reporting puts roughly
1 in 10 trays arriving in theatre with a missing instrument and
1 in 20 with a broken one. Smaller trays with accurate count sheets are the cheapest available intervention against both, because there is less to miscount and less to break.
A worked example: 94 instruments down to 44
This walks the real published general surgery tray so you can copy the arithmetic with your own numbers.
Starting point. A major general surgery tray of 94 reusable instruments, observed across 162 procedures. Average instruments used per case: 19. Instruments never used once in 162 cases: 10.
| Step | Action | Result |
|---|
| 1 | Remove the 10 instruments never used across 162 cases | 94 → 84. No clinical argument possible |
| 2 | Flag everything used in under 20% of cases | Candidate list generated. This is where the bulk sits |
| 3 | Clinician sign-off line by line; standing exceptions kept | Observation-based optimisation in this study reached a 54% cut, i.e. about 44 instruments remaining |
| 4 | Re-weigh the rebuilt tray | Weight fell by the same 54%, comfortably inside the 25 lb ceiling with the basket counted |
| 5 | Cost the change | Cost per use down 55% |
| 6 | Build the retrieval plan | Removed instruments peel-packed individually; expect roughly 10% of cases to open one |
| 7 | Re-issue count sheet, container label and physical tray together | Single-day cutover, revision recorded |
Multiply before you celebrate. The saving is per tray copy, per cycle. If you hold 12 copies of that tray and each turns over 200 times a year, a $1.56 per-instrument reprocessing cost and 50 instruments removed gives 50 × $1.56 × 200 × 12, which is roughly $187,000 a year from one tray type. Use your own per-instrument cost and your own turnover; the structure of the calculation is what matters.Environmental note for anyone with a sustainability target attached to this work: the same 94-instrument tray was measured at 1.25 kg CO
2-equivalent per use, and optimisation cut emissions by a modest 0.91% to 2.69% depending on the threshold used. Be honest about that in the business case. The financial and time arguments here are strong; the carbon argument, on this evidence, is real but small.
From decision to rebuilt set: how to specify and order
This is the step that stalls most tray projects. The audit finishes, the reduced list is agreed, and then someone has to convert “44 instruments, these patterns, these sizes” into something a supplier can quote and build. Done loosely, you receive a set that is nearly right, which is worse than useless because the count sheet now has to change again.
Write the specification so it cannot be misread
Six fields per line. Anything less and you are relying on the supplier’s interpretation of an instrument name, which, as our
tray list reference documents in detail, is the single largest source of wrong deliveries in this industry.
| Field | Example | Why it matters |
|---|
| Eponym plus generic description | Kocher (Ochsner) artery forceps, 1×2 teeth, straight | The eponym alone is ambiguous across catalogues and countries |
| Length in mm | 160 mm | The commonest silent substitution. Never write “medium” |
| Pattern detail | Straight / curved, serration type, ratchet or non-ratchet | Decides whether the instrument does the job at all |
| Material and insert | Surgical-grade stainless steel; tungsten carbide insert where required | Affects grip life, price and whether the item tolerates your reprocessing chemistry |
| Quantity per tray | 6 | State it per tray copy, and state how many copies |
| Your own reference number | Your count-sheet line ID | Lets you reconcile the delivery against the sheet without translating names twice |
Order the reduced set, not a catalogue set
The instinct is to buy a pre-built set and remove what you don’t need. That is how the tray got fat in the first place, and you pay for every instrument you then throw in a drawer. Specify the reduced list and have it built. From a manufacturer that is a normal request, not a special one.NJ Medical Instruments has manufactured surgical, dental and ENT instruments in Sialkot since 1990, as an OEM and direct supplier. Around 1,750 instruments are listed on this site and over 10,000 are available across the range, single-use and reusable. Practically, that means a 44-line count sheet can be quoted line by line and built as one set, in your quantities, under your own numbering.Useful starting points if you are assembling a specification now:
- General surgery instrument sets and general surgical instruments for laparotomy, hernia and soft-tissue trays
- Orthopaedic sets and spinal instrumentation, where the heaviest and most over-filled trays usually sit
- ENT complete sets and ENT instrument sets for tonsillectomy, myringotomy and sinus trays
- Plastic surgery sets and the wider plastic surgery range
- Line items that appear on almost every tray: artery forceps and ligature clamps, thumb forceps, hooks and retractors, surgical retractors, towel clamps, sponge holding forceps, suction tubes and osteotomes
- If pattern choice is the open question, see our guides to choosing surgical forceps, choosing surgical scissors and dental extraction forceps
- For quantities, lead times and supplier checks, read bulk buying surgical instruments. If you are equipping from scratch rather than trimming, start with the ten sets an operating theatre needs
Frequently asked questions
What is surgical instrument tray optimization?
It is the process of measuring which instruments on a surgical tray are actually used, removing the ones that are rarely or never used, and rebuilding the set and its count sheet around the reduced list. It is also called tray rationalisation, tray right-sizing or Lean tray reduction.
What percentage of instruments on a surgical tray go unused?
Published audits put utilisation between 10.7% and 58%, so between 42% and 89% go unused in a given case. Ambulatory hand surgery measured 10.7% utilisation with an average of 120 instruments opened and 12.6 used. Orthopaedic trays measured 23.4% before optimisation. One multi-service survey reported an average of 87% unused.
How much does it cost to reprocess one surgical instrument?
The figure used across this literature is $0.51 to $3.19 per instrument per cycle. One US academic centre costed its own at $1.56. Inside a tray the per-instrument cost is lower than in a peel pouch, roughly $0.34 to $0.47 against $0.81 to $0.84, because the packaging and handling are shared.
How many instruments should a surgical tray contain?
There is no universal number, because it depends on the procedure. The defensible answer is: as few as the procedure needs in at least 20% of cases, plus a named list of low-frequency exceptions that would stop the operation if absent. Published rebuilds landed at 47 instruments from 88 for a major orthopaedic tray, about 44 from 94 for a major general surgery tray, and 23 from 120 for an ambulatory hand tray.
What is the maximum weight for a sterilisation tray?
25 lb, about 11.3 kg, including the basket, the instruments and the container or wrap. The limit comes from ANSI/AAMI ST79 and ST77. Above it, drying becomes unreliable, which raises wet-pack risk, and the lifting risk to sterile processing staff rises.
Which method finds the most instruments to remove?
Direct observation of real cases. In a head-to-head comparison on the same tray, observation supported a 54% reduction while a staff survey supported 22%. A mathematical inventory model also outperformed clinician review, cutting an 88-instrument tray to 47. A structured survey combined with cost-inflection analysis gives close to observation-level results for much less effort.
Does reducing a tray cause delays when a missing instrument is needed?
Rarely, and it is measurable. After a 39% reduction to a minor urology tray, only 10% of cases needed an extra instrument opened. Keep the removed instruments peel-packed and immediately available, and budget for that 10%.
How long does a tray optimisation project take?
The review itself is fast. An orthopaedic team averaged 7 minutes 35 seconds per tray to examine and select instruments for removal once they had usage data. Gathering the usage data is the slow part: published observation studies ran across 80 to 162 procedures, typically three to seven months. Surveys and existing usage data shorten that considerably.
Can we just buy a standard set and remove what we don’t need?
You can, but you pay for instruments you will never use and you inherit someone else’s naming. Specifying the reduced list and having the set built to it costs less and produces a count sheet that matches the tray on day one. Manufacturers build to count sheets routinely.
Does tray optimisation reduce environmental impact?
Yes, but modestly on current evidence. One measured tray produced 1.25 kg CO
2-equivalent per use, and optimisation reduced emissions by 0.91% to 2.69% depending on the removal threshold. The cost and time savings are far larger than the carbon savings. The reusable-versus-disposable decision has a much bigger environmental footprint, which we cover in our
reusable vs disposable analysis.
Who should be in the room?
A surgeon or two from the service, a scrub practitioner, someone from sterile processing who knows the real reprocessing cost, and someone who can authorise a count-sheet revision. Expect surgeons to support more removals than scrub staff, and answer scrub-staff caution with a retrieval plan rather than a vote.
Sources
- Reducing surgical instrument usage: systematic review of tray optimisation, environmental impact, cost and efficiency. BJS Open, 2025. academic.oup.com
- Surgical tray optimization: prospective and survey-based evaluation of environmental and economic outcomes (94-instrument major general surgery tray, 162 procedures). PubMed 41578021
- Utilization fraction of ambulatory hand procedures: cost reduction through tray optimization. Hand. PubMed 39548880
- Decreasing operating room costs via reduction of surgical instruments (paediatric urology). PubMed 30846251
- Crosby et al. Surgical instrument optimization to reduce instrument processing and operating room setup time. Otolaryngology–Head and Neck Surgery. PubMed 31638858
- Optimizing the surgical instrument tray to immediately increase efficiency and lower costs in the operating room. Canadian Journal of Surgery. canjsurg.ca
- Surgical instrument tray optimization process at a university hospital: a comprehensive overview (Aarhus). ScienceDirect
- Optimization of orthopedic surgical instrument trays: Lean principles to reduce fixed operating room expenses. ScienceDirect
- Optimizing spine surgery instrument trays to immediately increase efficiency and reduce costs in the operating room. ScienceDirect
- Reducing instruments in a vitrectomy surgical tray: cost savings from a major academic hospital. PMC7301997
- Vizient Viewpoints: optimization of surgical tray standardization to improve efficiency. vizientinc.com
- SpecialtyCare, summarising a 2020 BMJ Quality & Safety analysis of sterile processing defect rates. specialtycareus.com
- ANSI/AAMI ST79 and ST77 instrument set weight limit, summarised. courtemanche-assocs.com and OR Manager
- Set load, density, drying and ergonomics in sterile processing. HPN Online
- ANSI/AAMI ST108:2023, water for the processing of medical devices (critical-water final rinse). AAMI
Figures are reported as published by the cited studies. Reprocessing costs, theatre minute costs and savings are institution-specific; use your own sterile processing costing before building a business case.





One thought on “Surgical Instrument Tray Optimization: How Many Instruments a Tray Actually Needs”